How to Visualize Cryptocurrency Updates with CoinGecko and Bannerbear (No Code)
Contents
Crypto price charts illustrate numeric values in a way that’s much easier to digest. They can be found on cryptocurrency reporting sites and price trackers, with plenty of filters you can apply to view the exact information you need.
Traders and investors rely on live price charts to make informed decisions about buying and selling. However, there are times when a simple, presentable snapshot of key data is more suitable. At these times, automated image assets are often the perfect solution. Examples of use cases for automated image assets include:
- Illustrating articles and reports about market movements
- Providing real-time price information to customers
- Creating social content for crypto blogs and news outlets
Whatever the reason, automating the process of generating crypto price charts can save time and effort. In this tutorial, we will show you how to create dynamic and customizable crypto price charts using CoinGecko, Bannerbear, and Zapier without any coding skills required.
What You Will Create
Visualized snapshots of crypto pricing information make it easier to see what you need in a glance. We’ll be using CoinGecko’s API to gather only the necessary pieces of data, then deposit it into a Bannerbear template designed to chart crypto prices with ease.
The tools you will use to do this are:
- Bannerbear : To create dynamic templates and generate image assets
- CoinGecko : To retrieve crypto pricing data
- Zapier : To trigger actions in different programs based on pre-specified commands
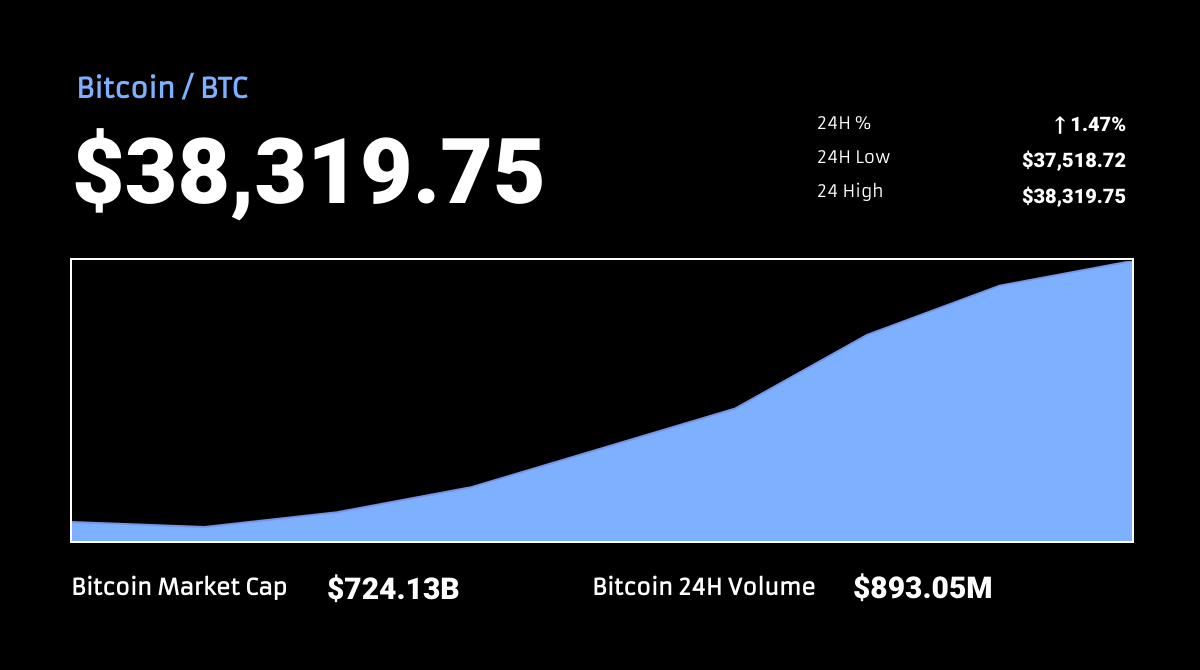
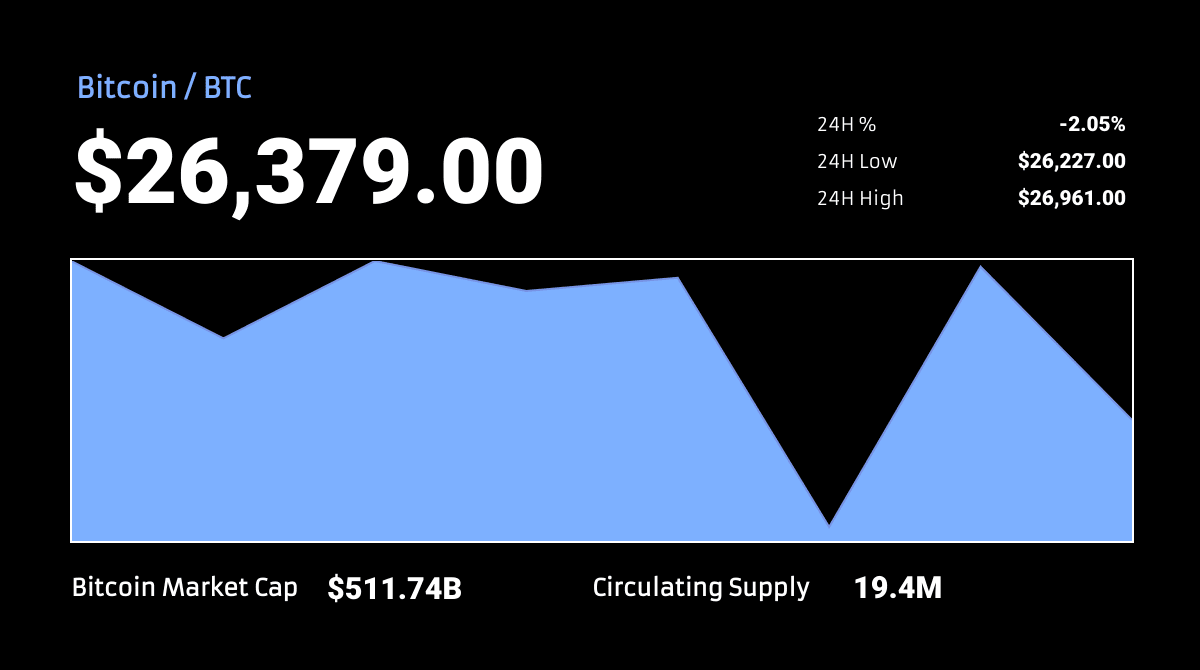
By the end of the tutorial, you should be able to generate a price chart that looks something like this:

Let’s get started!
Design a Bannerbear Template
A single template will consolidate crypto pricing information and can be customized to suit your needs.
Log into your Bannerbear account. From the Projects tab, click New Project and add a template. You can click Create a Template to start with a blank slate, but for this tutorial, we’ll use one of the selections in our library:
Make modifications to suit your use case. You might to track different pricing information or prefer a different color. Be sure to use dynamic fields for the data components that will be changing every time the automation runs.
Click Save Template when you’re done.
Prepare CoinGecko GET Request
CoinGecko is an independent cryptocurrency data aggregator with a free public API you can use to retrieve updated pricing information. While they don’t have a native integration with Zapier, their API documentation contains endpoints with parameters you can modify to generate a custom request URL, which can then be used as a webhook.
To get a request URL for your pricing data, go to CoinGecko’s API documentation.
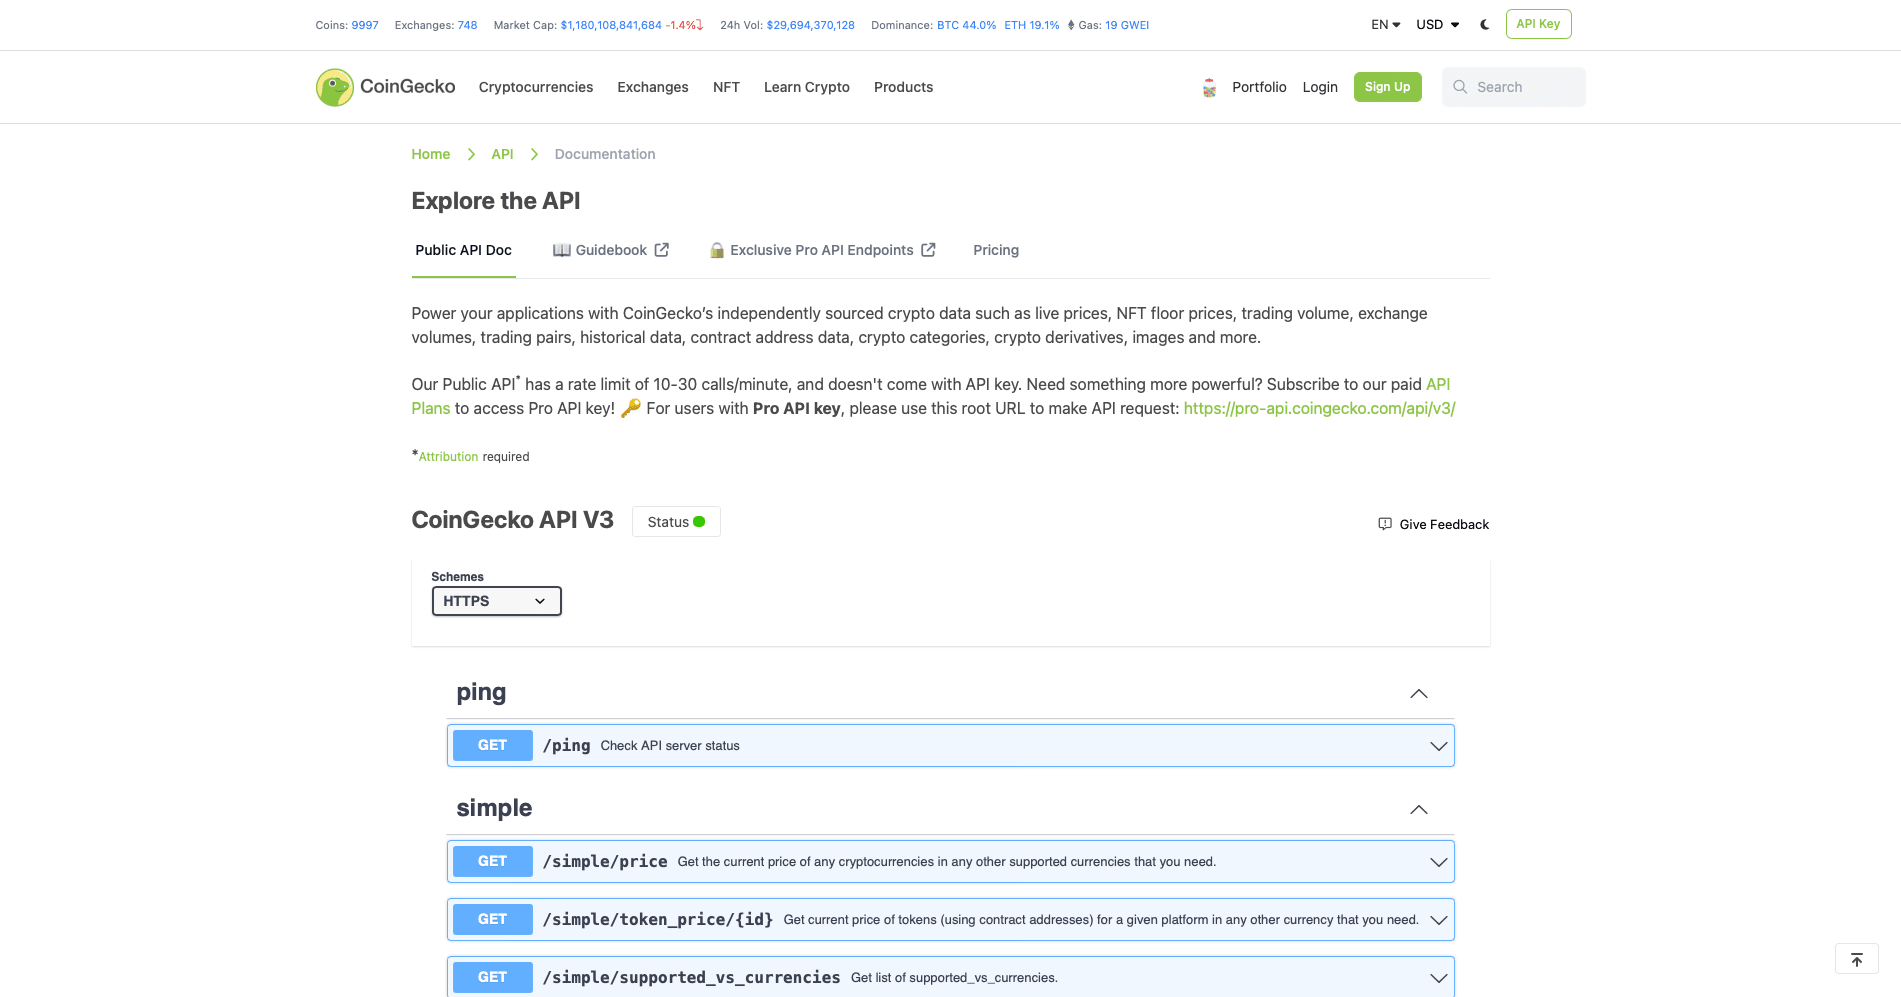
Scroll down to the /coins section, and click /coins/markets to reveal a drop down section. Click Try it out.
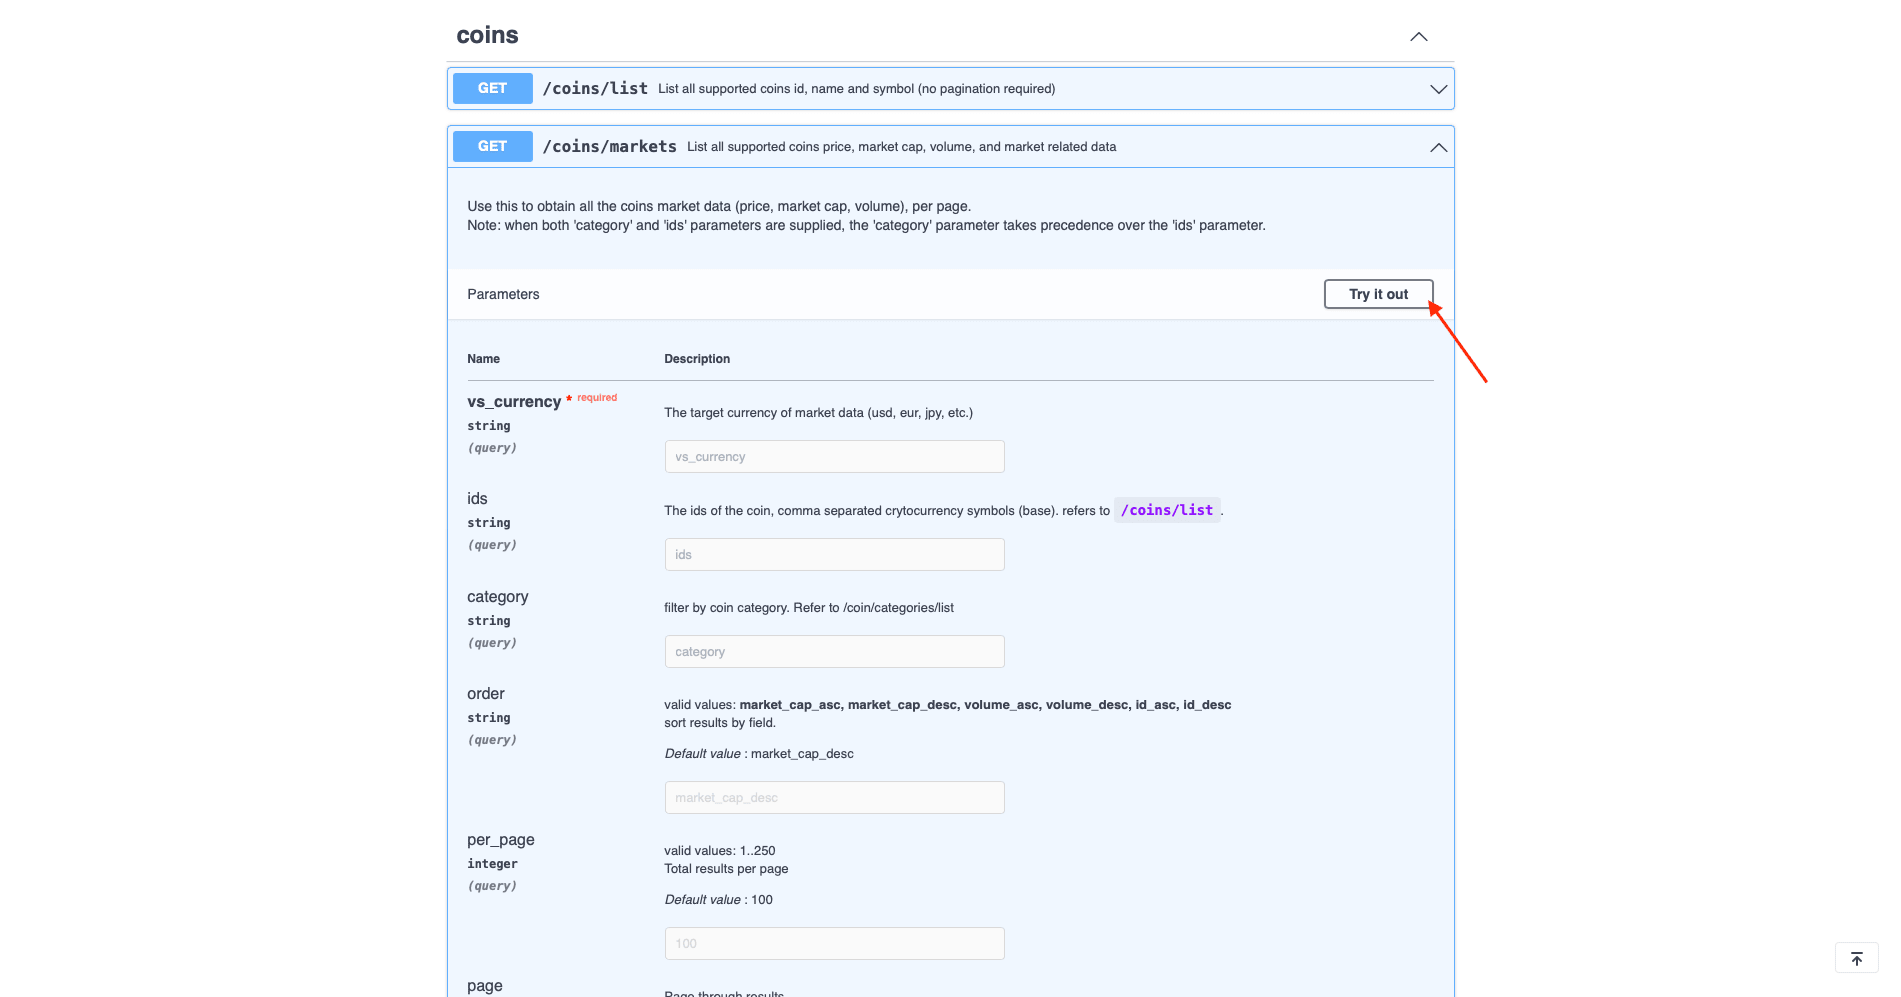
Now, select a target currency and make any changes necessary to the parameters. In this tutorial, we used USD and kept all other parameters standard.
Click Execute.
You should now see a Curl script, a Request URL, and a server response.
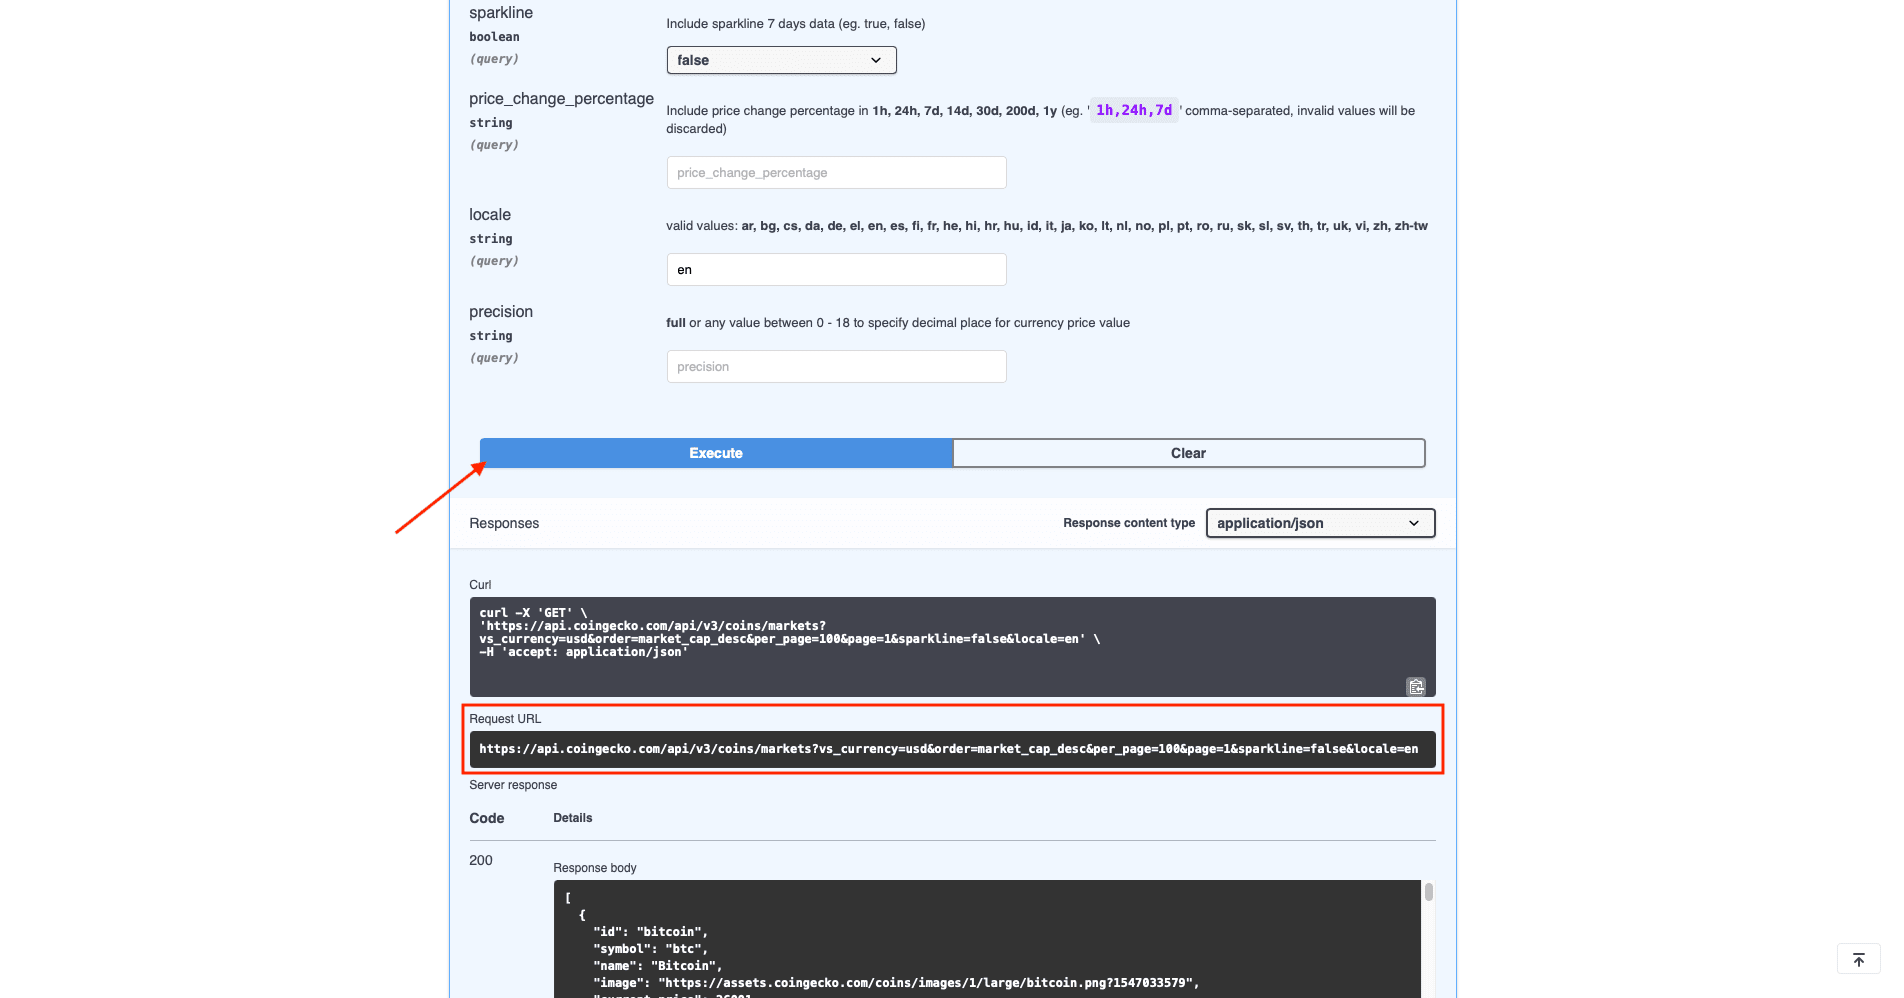
Copy the Request URL. It should look something like this:
https://api.coingecko.com/api/v3/coins/markets?vs_currency=usd&order=market_cap_desc&per_page=10&page=1&sparkline=false%22,%22/name,/current_price,/market_cap,/price_change,/total_volume,/high_24h,/low_24h
We will use this to send a GET request to CoinGecko’s API later on.
Set up a Zap to Auto-generate Crypto Price Charts
A single zap will trigger on schedule, retrieving crypto information, formatting the data, and generating an image containing a pricing chart.
❗️ Note : If you want to generate a test image before publishing your zap, you will need to use another method to manually retrieve pricing data from different dates. More tips will be provided in the next section: Tips on Testing Your Pricing Chart.
From your Zapier dashboard, click + Create Zap and set up the following events:
Trigger: Every Day in Schedule by Zapier
Choose Schedule by Zapier as the app and Every Day as the event. Set up the trigger to activate when you need it to, keeping in mind that this schedule is for how frequently pricing data is requested and not necessarily for how often an image will be generated.
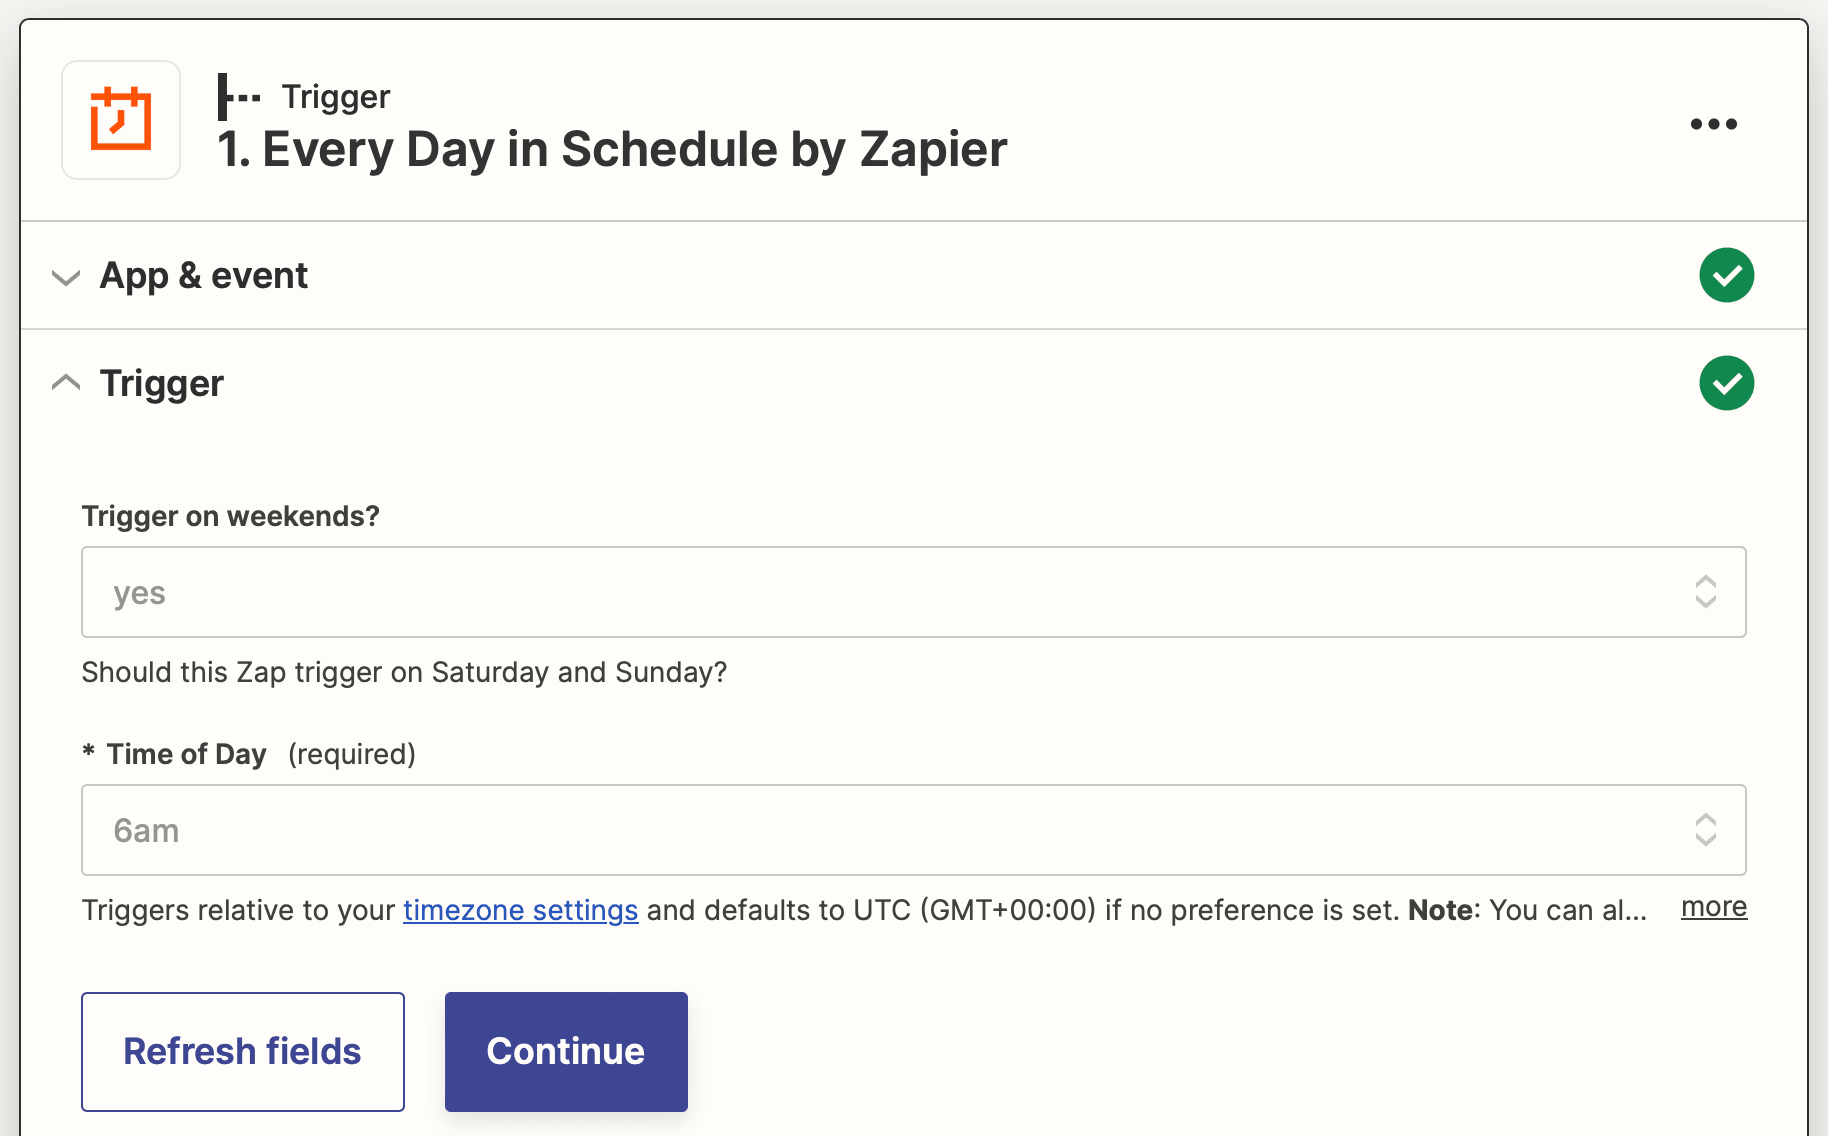
Test your trigger.
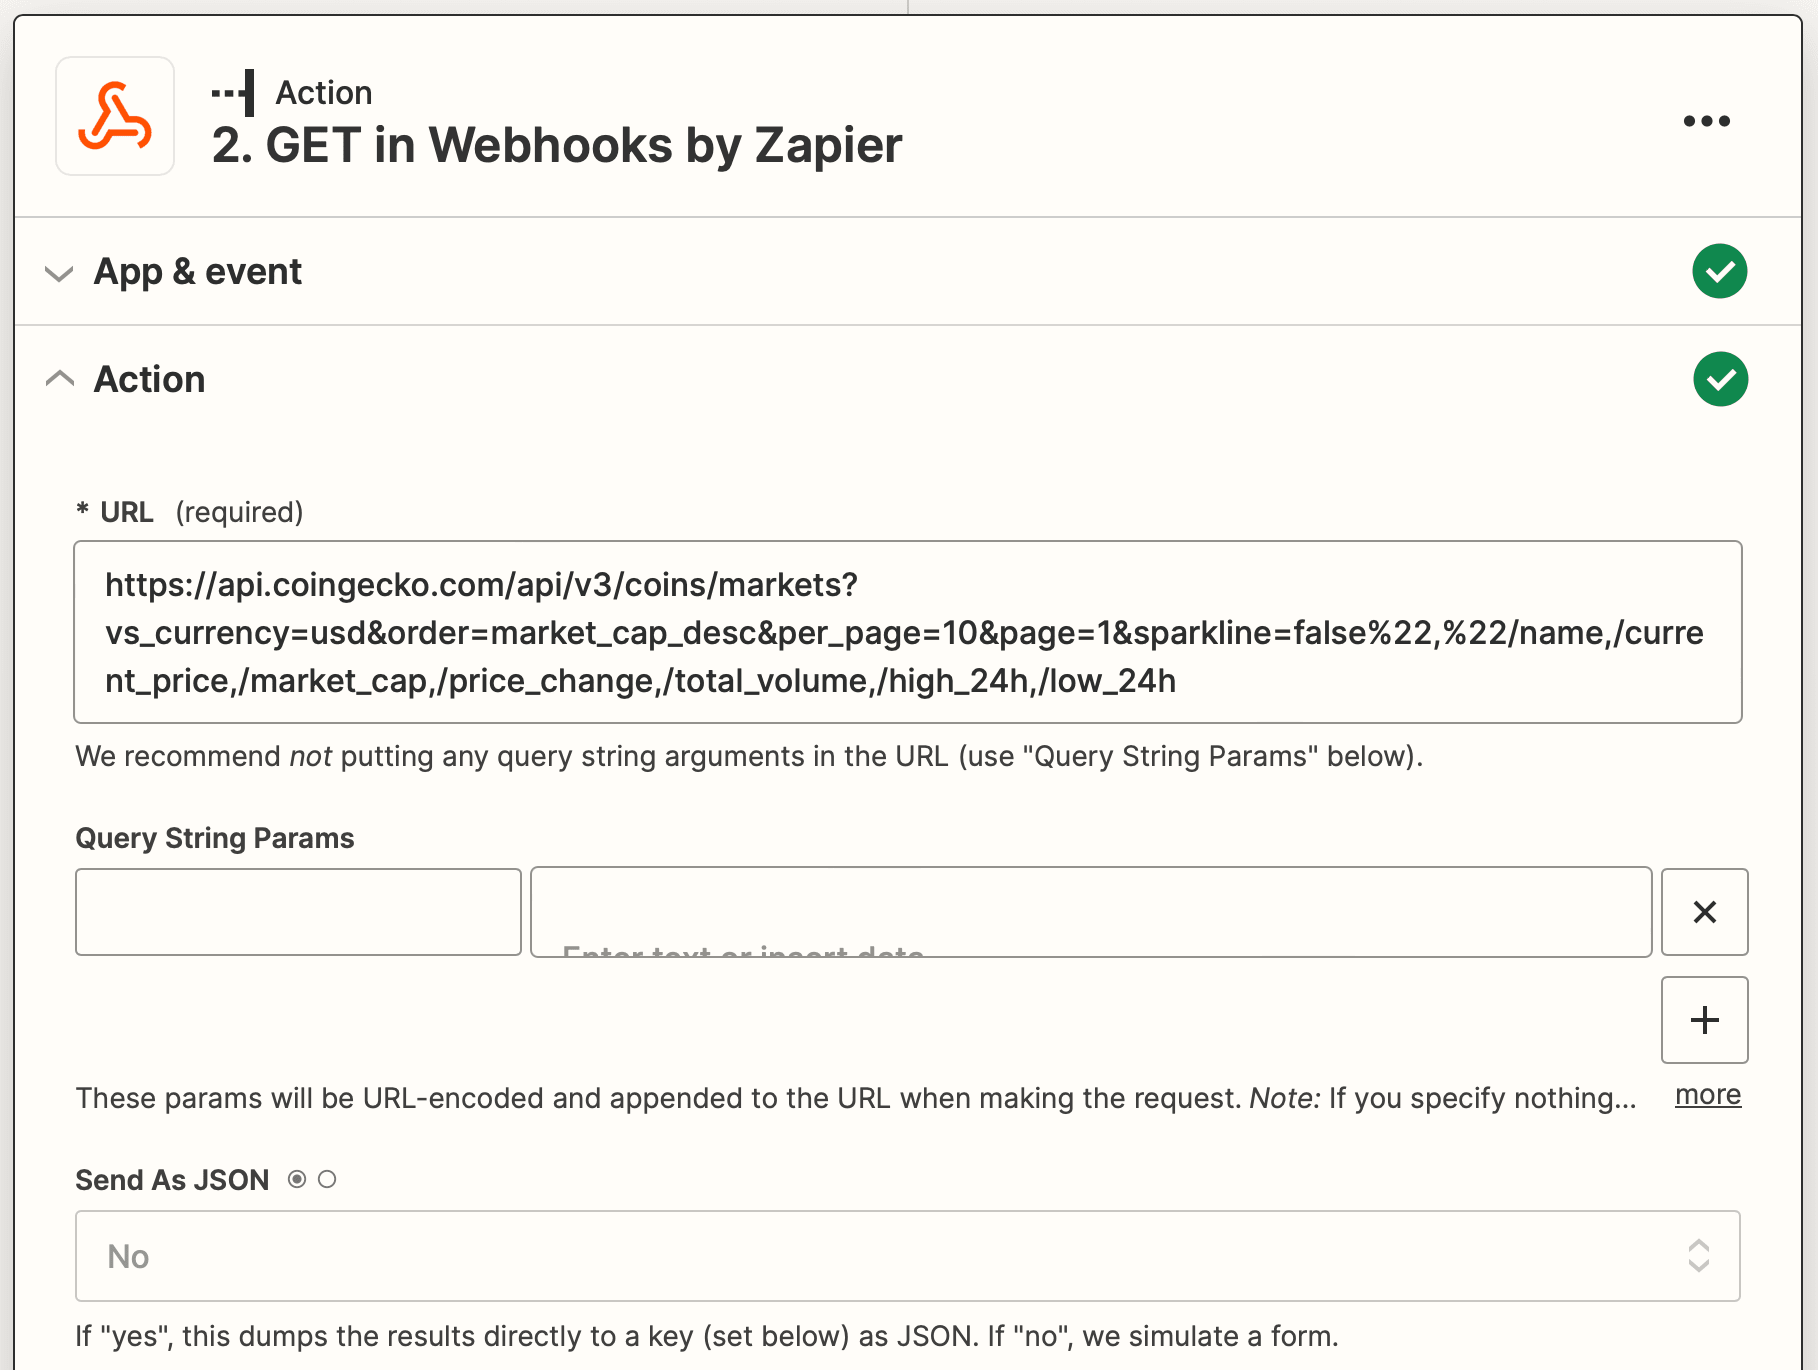
Action: GET in Webhooks by Zapier
Choose Webhooks by Zapier as the app and GET as the event.
Set up the action by pasting the CoinGecko request URL from earlier into the URL section. Choose No for the Send As JSON option.
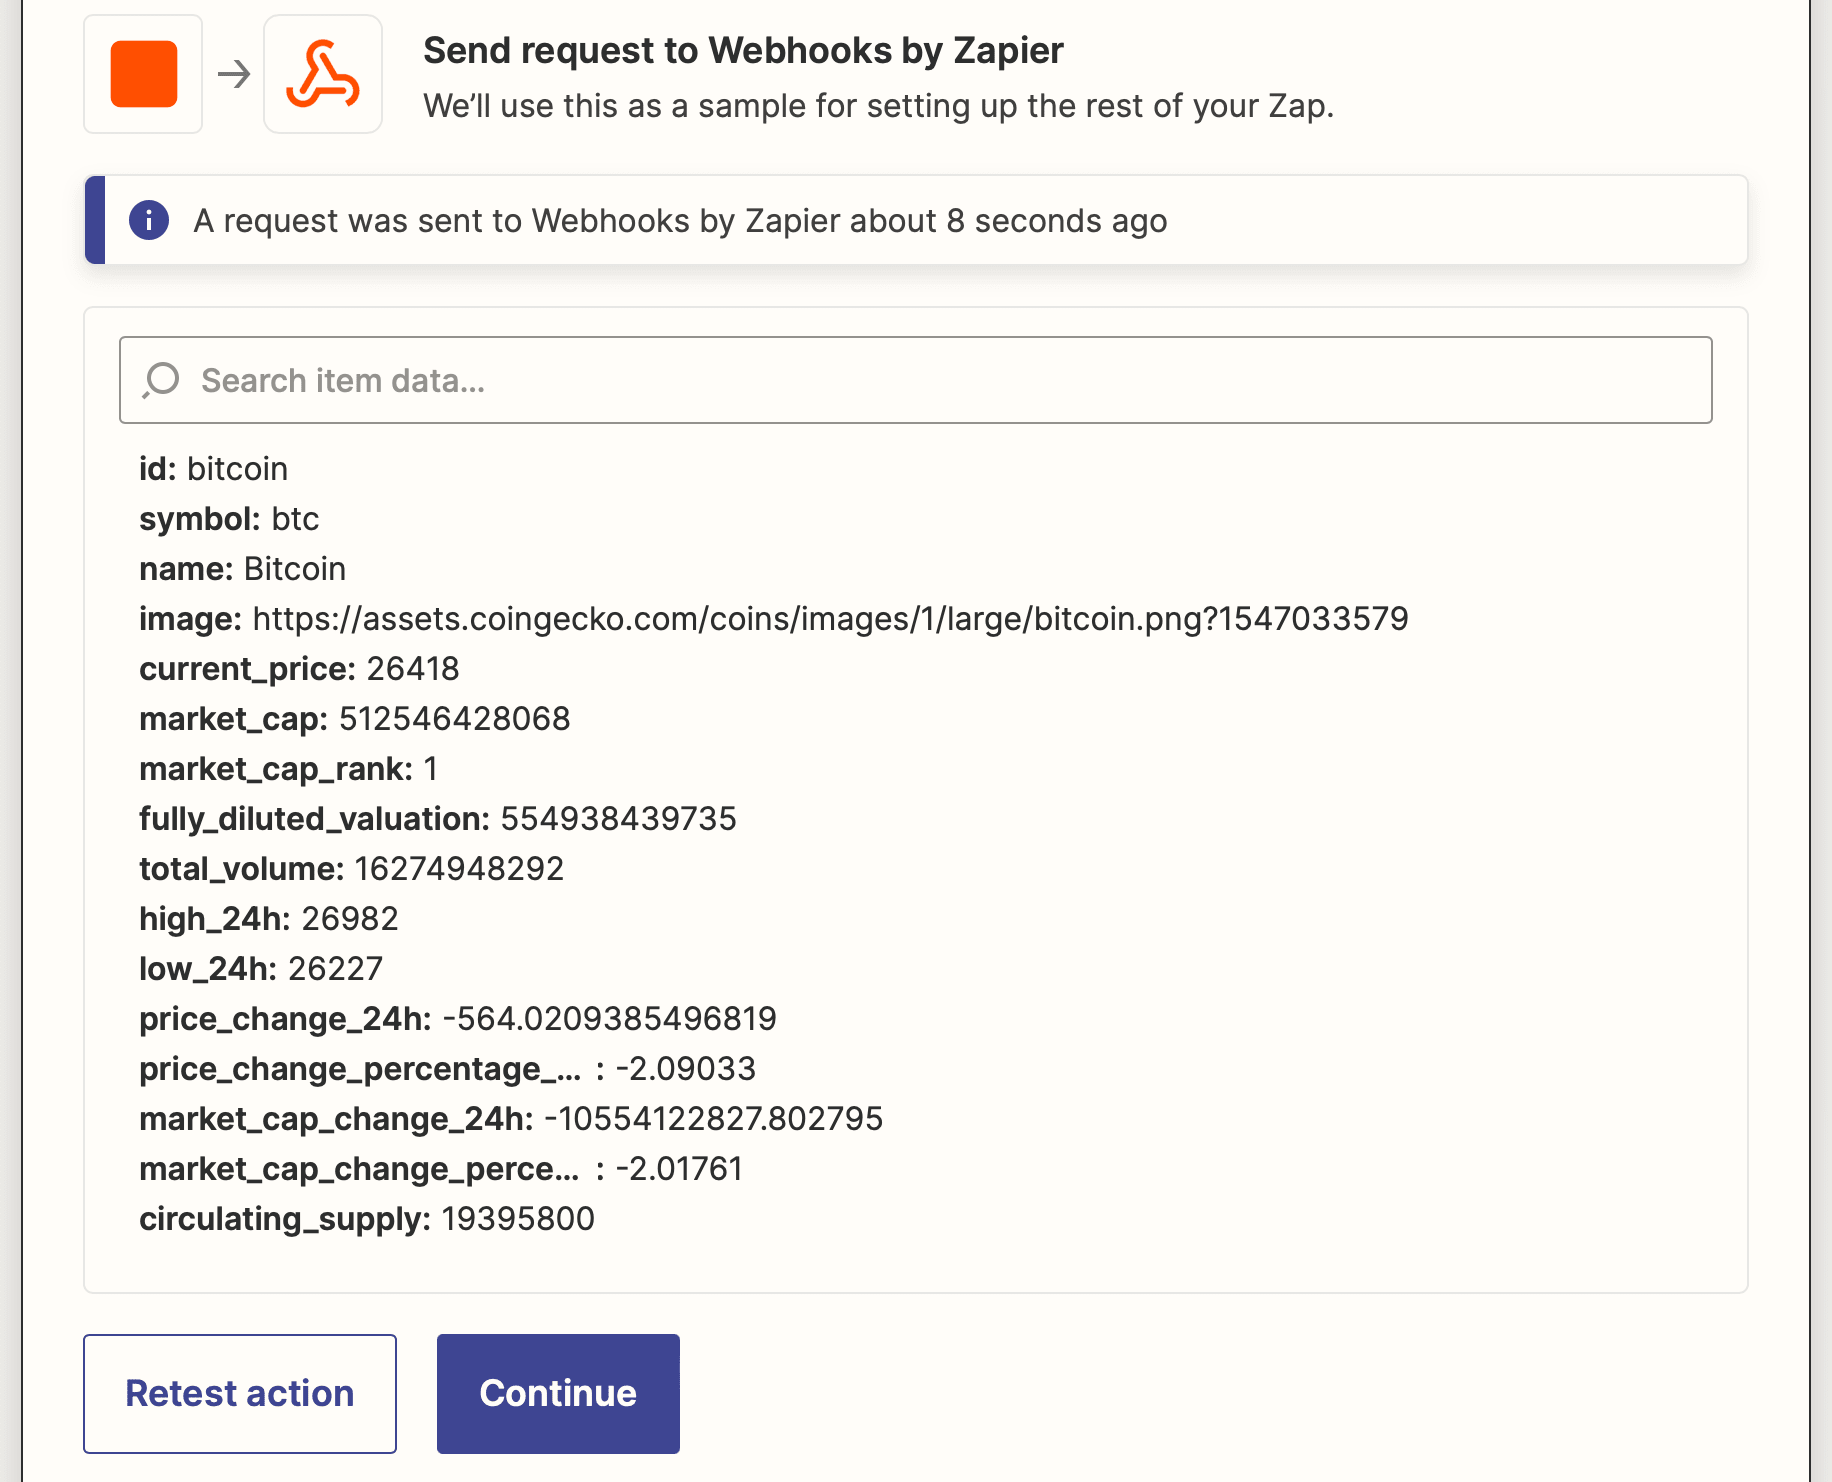
Click Continue and test the action. The data retrieved should look something like this:
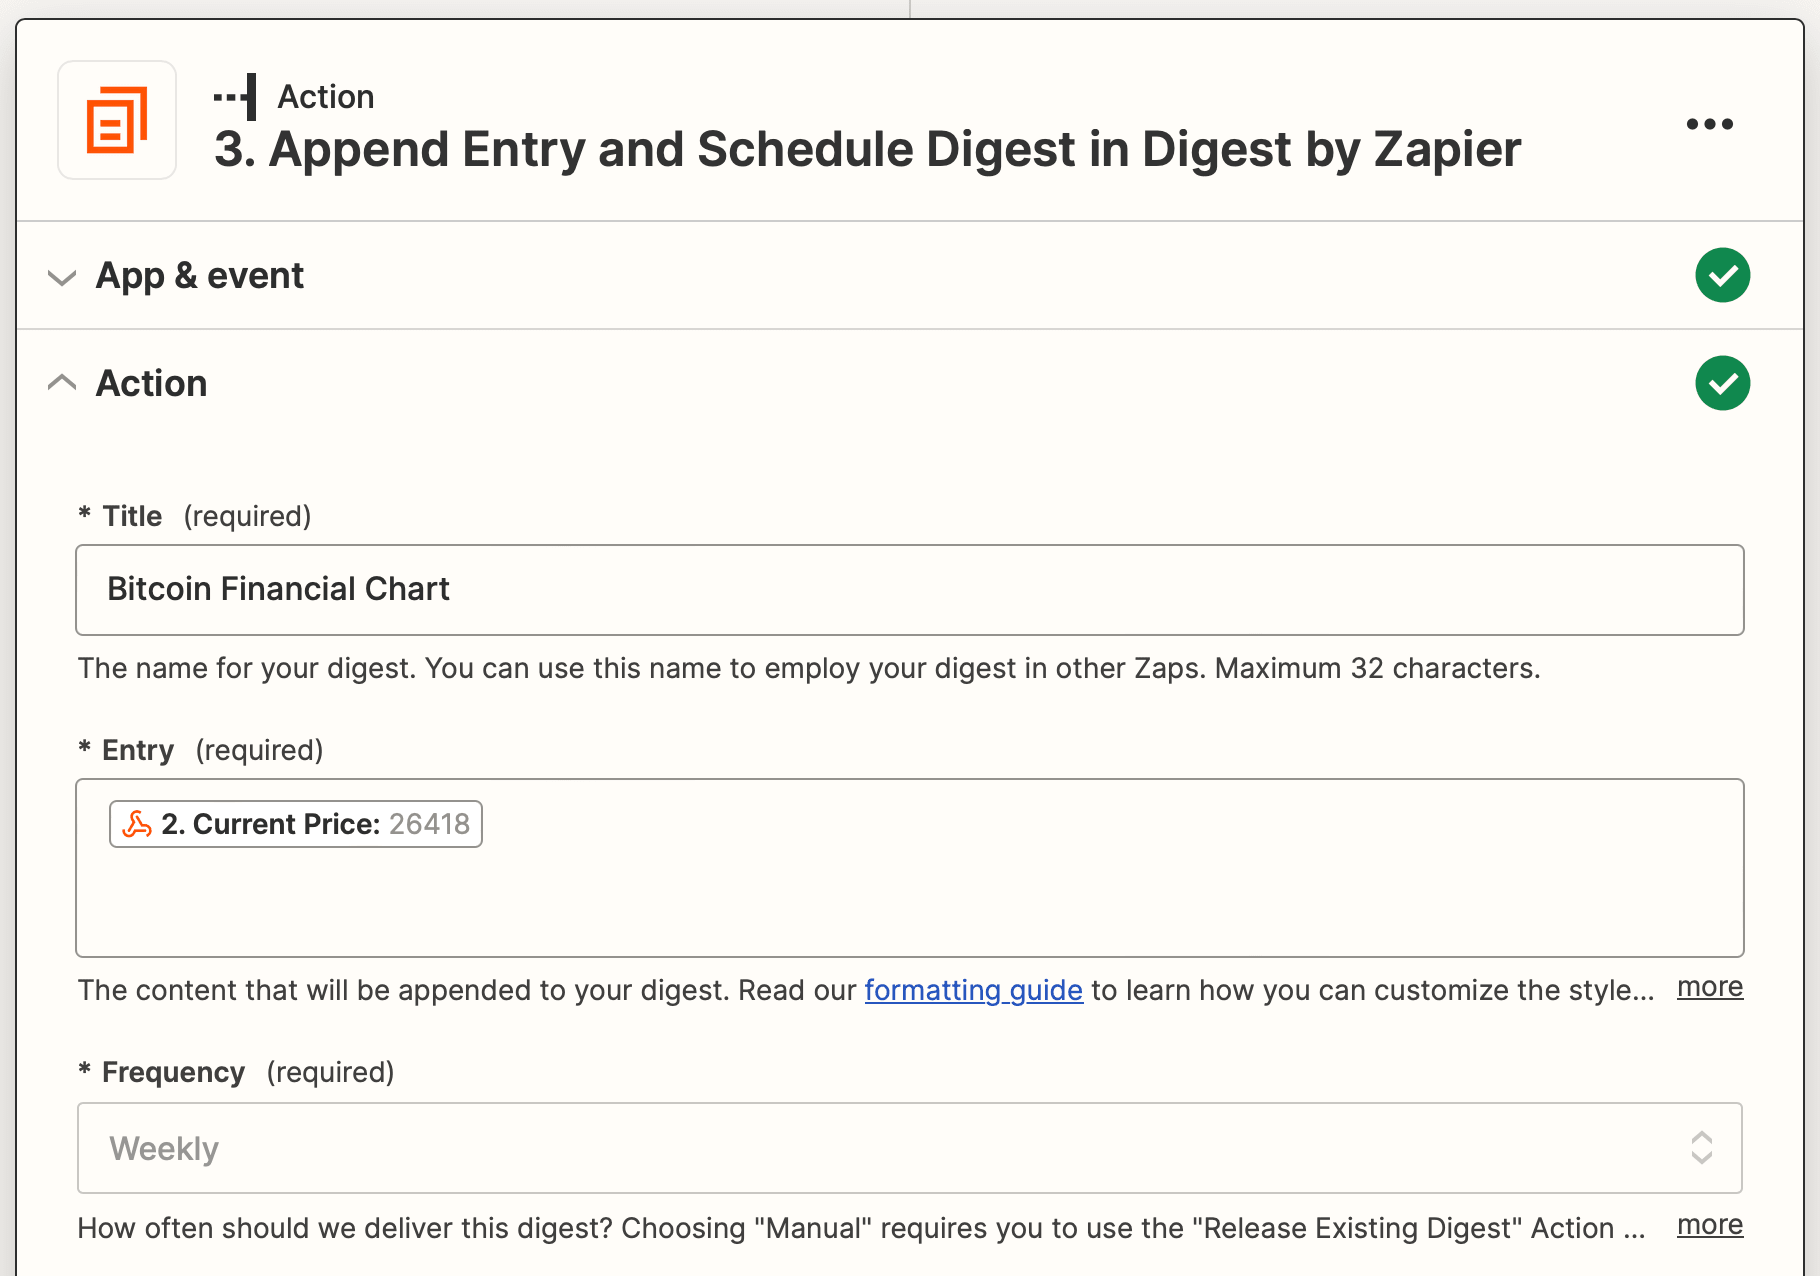
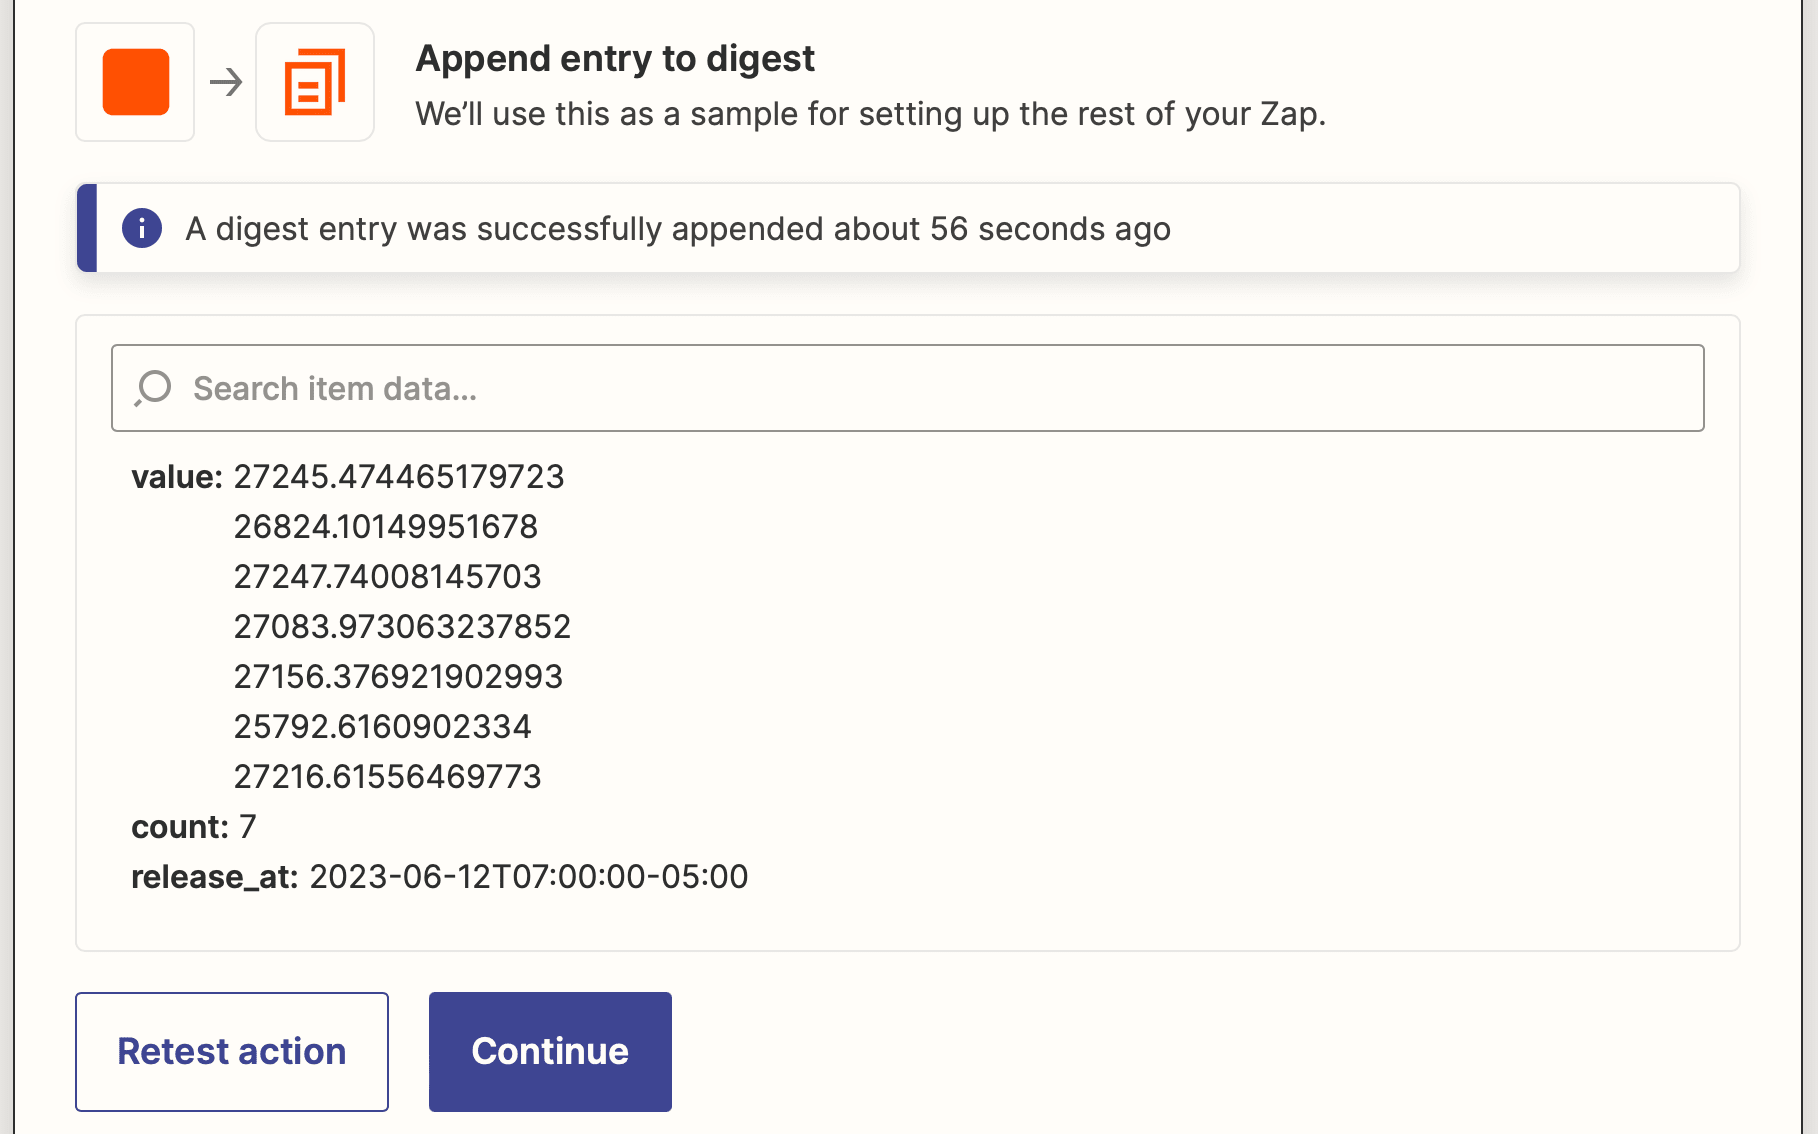
Action: Append Entry and Schedule Digest in Digest by Zapier
This action will accumulate data over a specified amount of time (or a specific number of times), delivering it as a single batch when requirements are met. We will use it to compile pricing data and generate a chart.
Choose Digest by Zapier as the app and Append Entry and Schedule Digest as the event.
Set up the action by adding a Title and mapping Current Price information in the Entry section.
Bear Tip 🐻: Zapier doesn’t currently have a feature for clearing a digest, so it’s best to create a separate one for testing. You can change the title to create a new digest when you’re ready for zap to go live.
Specify a frequency, day of the week, and time of day you want the digest to be delivered. We will use a weekly frequency in this tutorial.
Test the action. You should see output and a count value.
❗️ Note : If you are using the request URL that retrieves only current pricing data, you will only get one value every time the zap is run. Manually retrieving values will allow you to test the entire workflow. Otherwise, you can take the zap live at the end of the tutorial, keeping in mind that it will take an entire data accumulation cycle before you can see how the final chart should look.
Action: Numbers in Formatter by Zapier (Price)
Bear Tip 🐻: The following Numbers in Formatter by Zapier steps are solely to format the values in a more presentable way. It’s best to rename them to be more descriptive, as this will make mapping fields easier later on.
Choose Formatter by Zapier as the app and Numbers as the event.
In the setup section, choose Format Currency as the transform type, then use the Current Price value as the Input. Specify currency and locale, then insert the following in the Currency Format field: ¤#,##0.00.
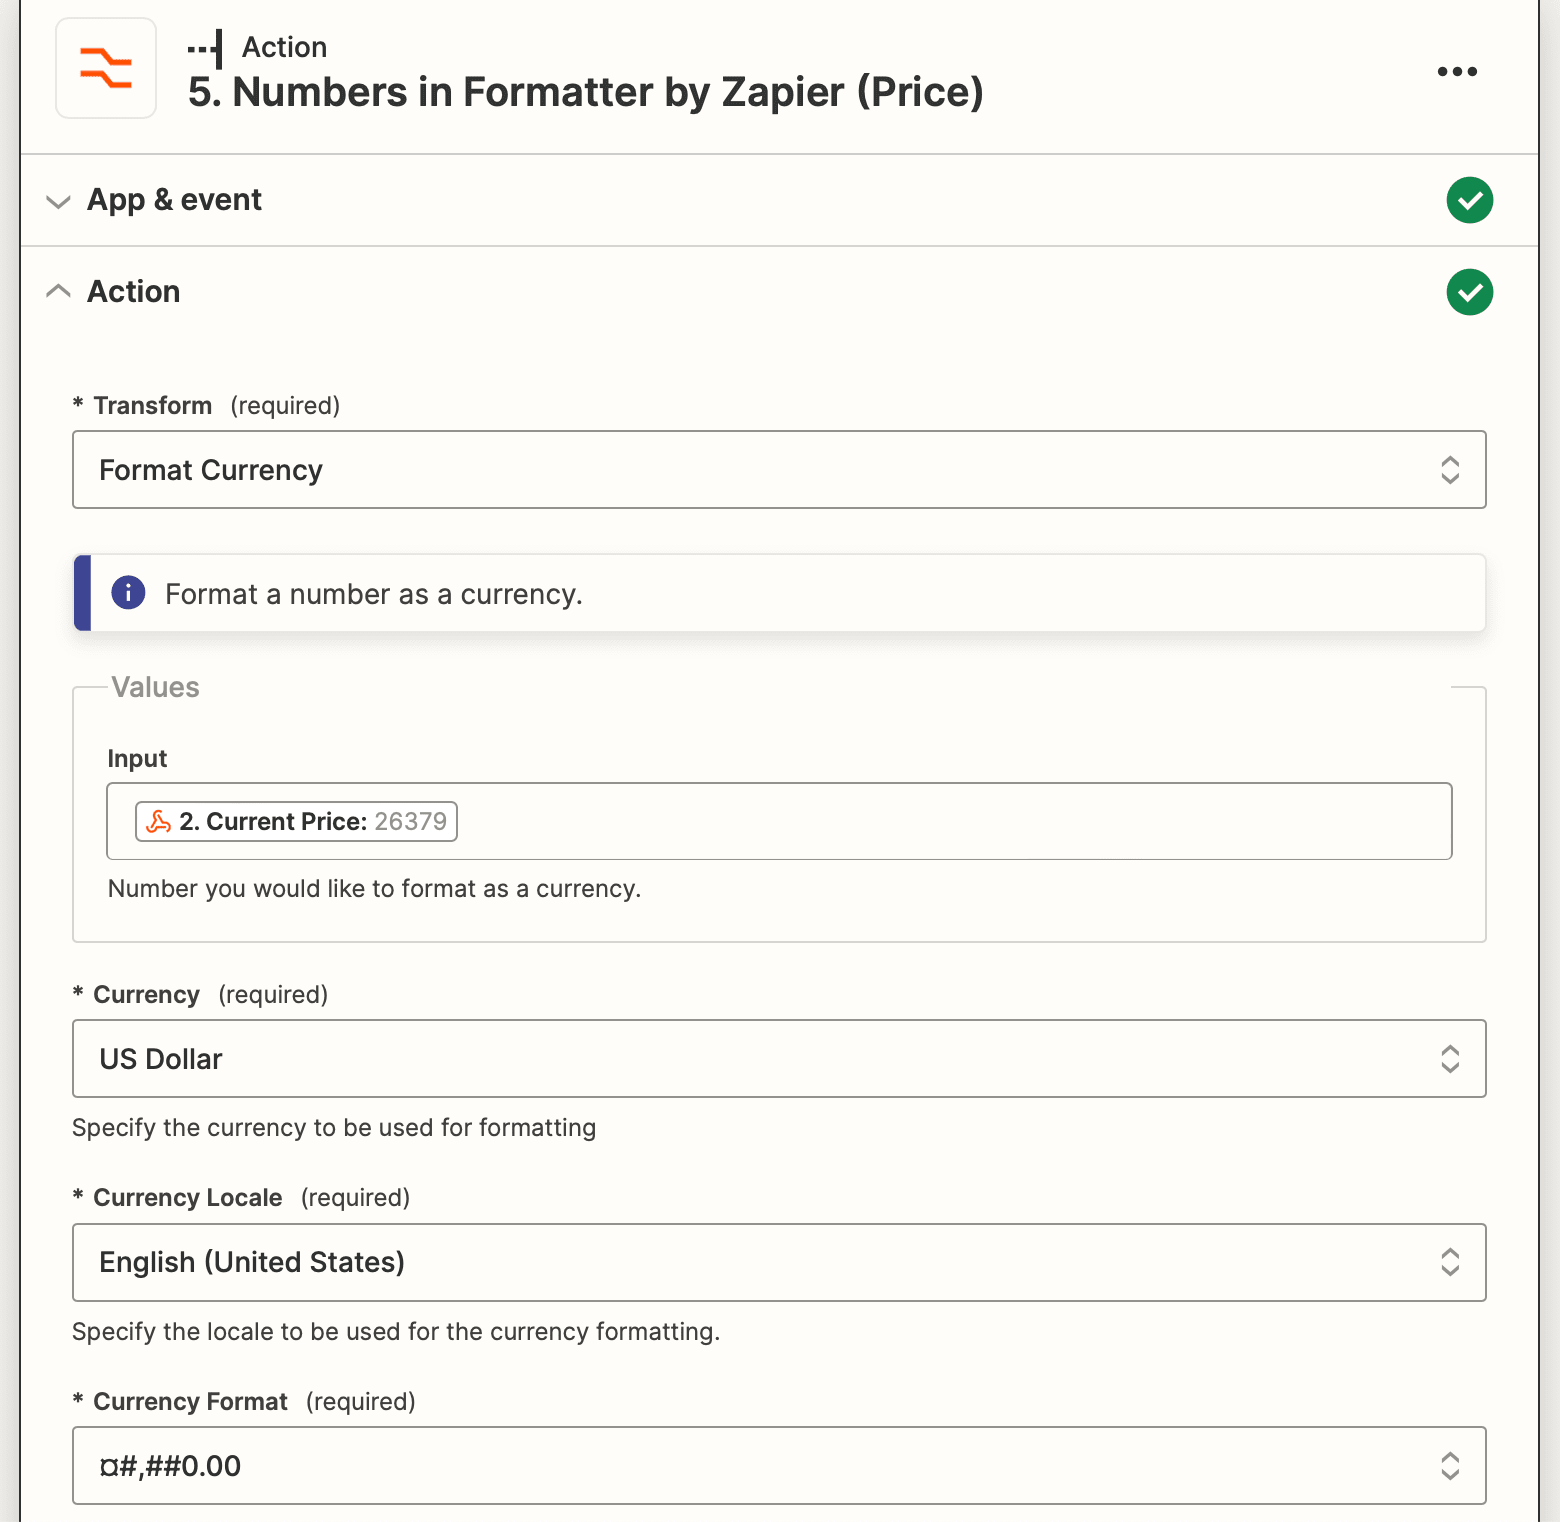
Test the action.
Action: Numbers in Formatter by Zapier (Circulating Supply)
Choose Formatter by Zapier as the app and Numbers as the event.
Set up the action by choosing Spreadsheet-Style Formula as the transform type, then insert the following in the Formula field: ROUNDUP({2. Circulating Supply: (value)}, 1000000),2).
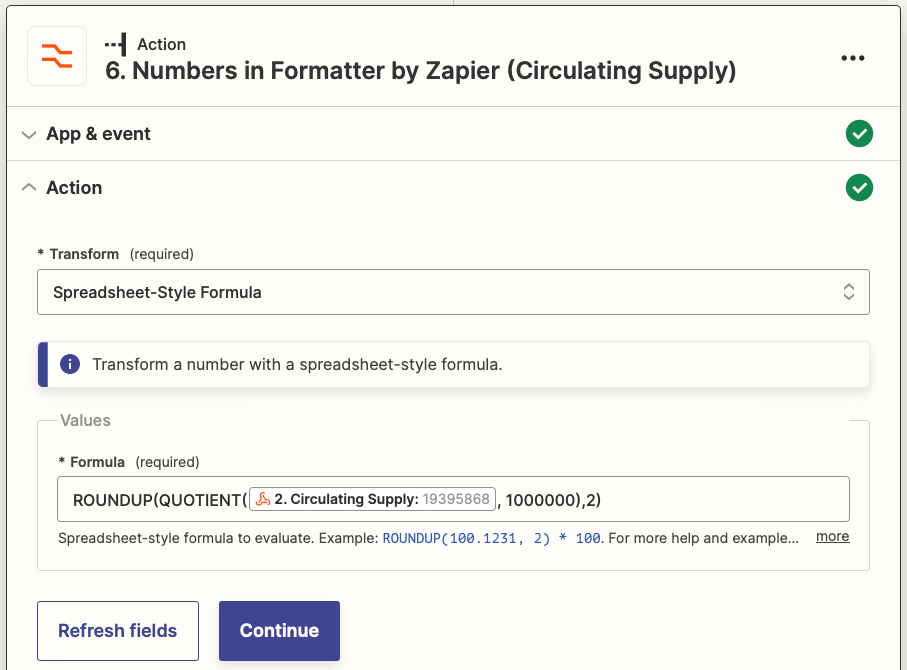
Test the action.
Action: Numbers in Formatter by Zapier (Market Cap Rounding)
Choose Formatter by Zapier as the app and Numbers as the event.
Set up the action by choosing Spreadsheet-Style Formula as the transform type, then insert the following in the Formula field: QUOTIENT({2. Market Cap: (value)}, 1000000000).
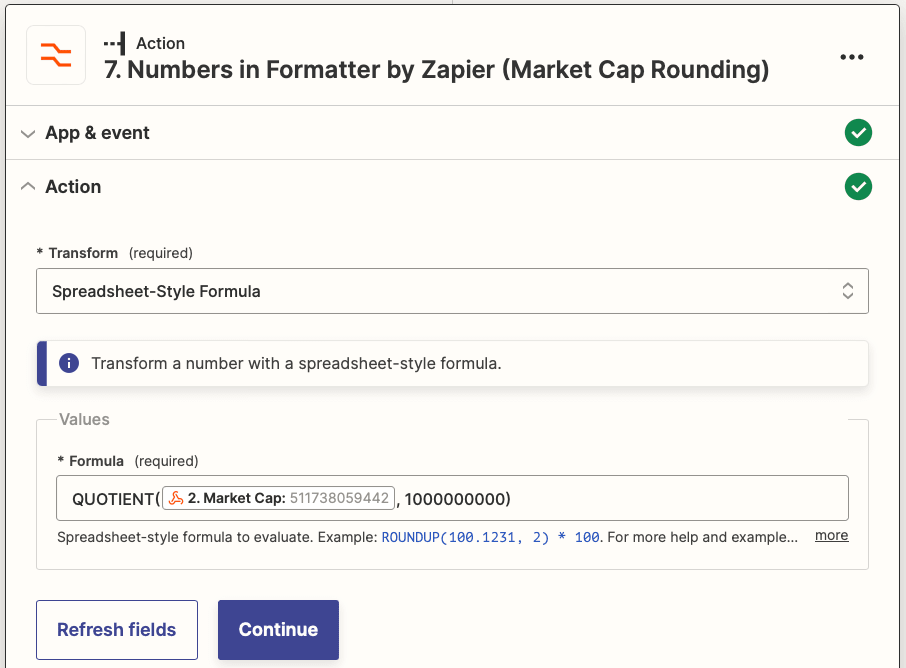
Test the action.
Action: Numbers in Formatter by Zapier (Market Cap)
Choose Formatter by Zapier as the app and Numbers as the event.
Set up the action by choosing Format Currency as the transform type, then use the output value from the Market Cap Rounding step as the Input. Specify currency and locale, then insert the following in the Currency Format field: ¤##0.00B.
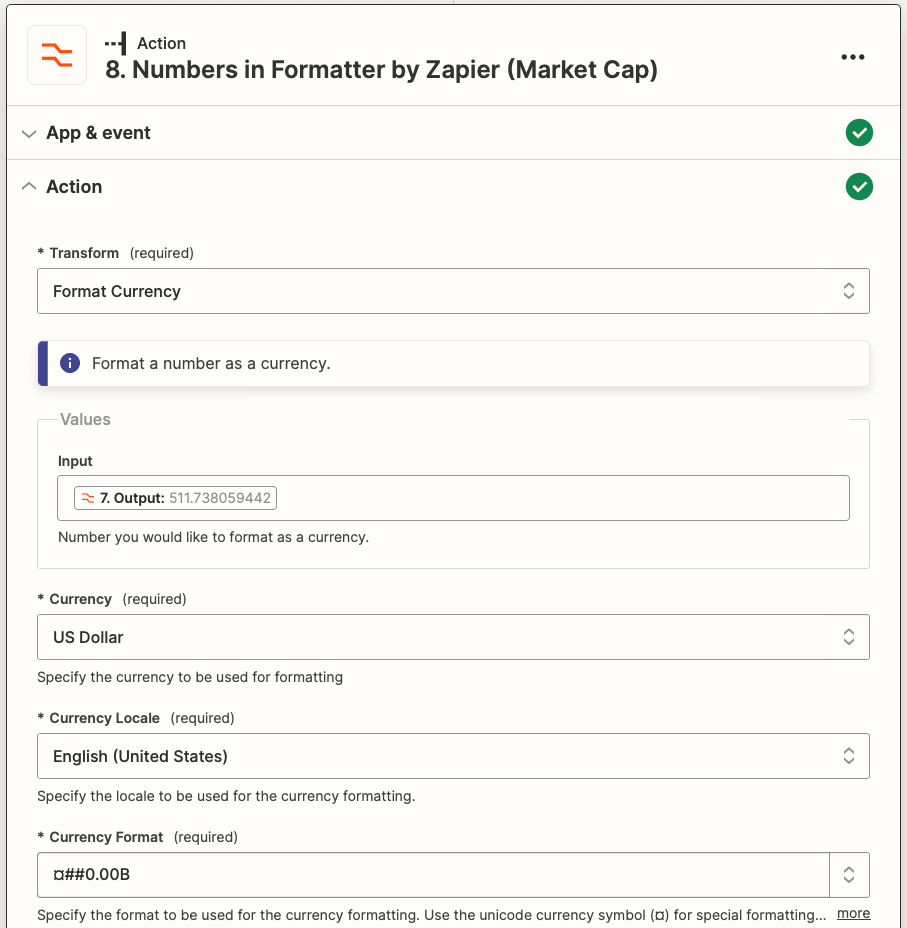
Test the action.
Action: Numbers in Formatter by Zapier (24H %)
Choose Formatter by Zapier as the app and Numbers as the event.
Set up the action by choosing Spreadsheet-Style Formula as the transform type, then insert the following into the Formula field: ROUNDUP({2. Price Change Percentage 24 H:(value)},2).
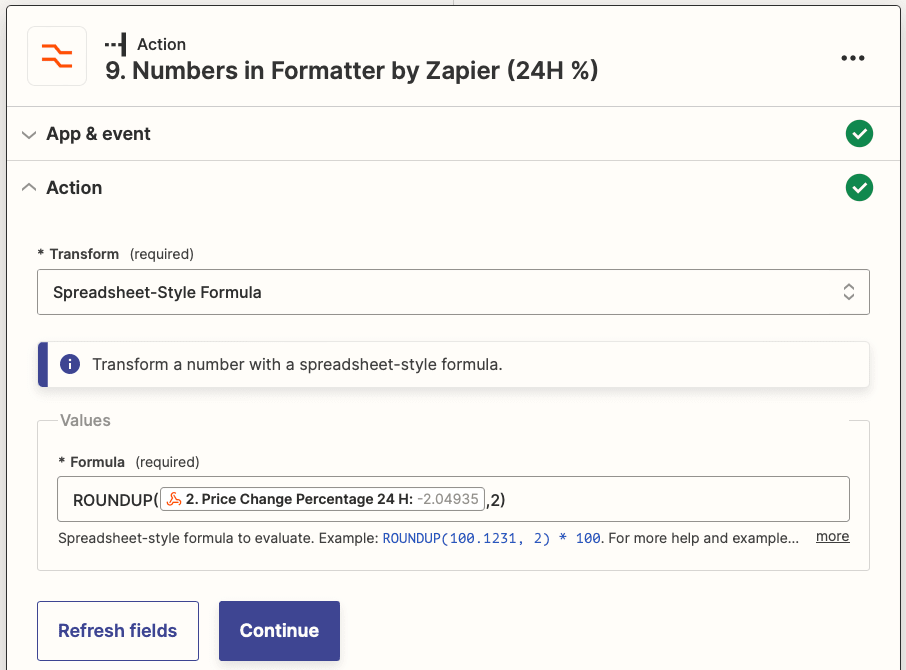
Test the action.
Action: Numbers in Formatter by Zapier (24H Low)
Choose Formatter by Zapier as the app and Numbers as the event.
In the setup section, choose Format Currency as the transform type, then use the Low 24 H value as the Input. Specify currency and locale, then insert the following in the Currency Format field: ¤#,##0.00.
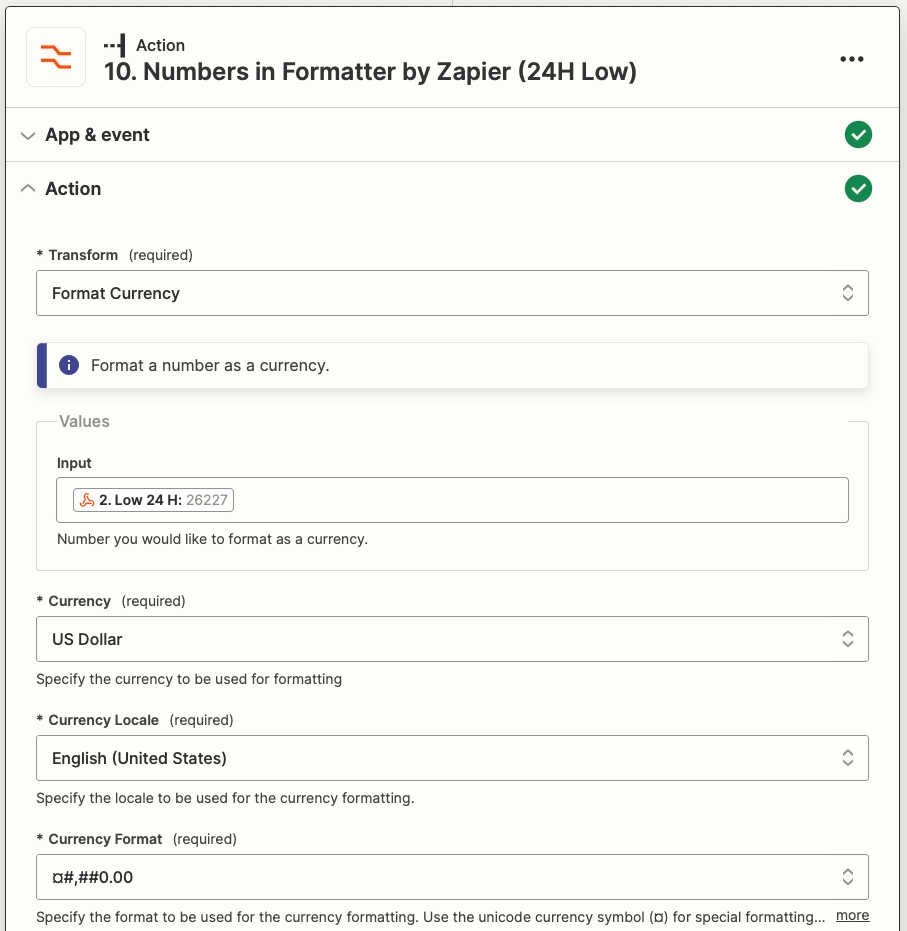
Test the action.
Action: Numbers in Formatter by Zapier: (24H High)
Choose Formatter by Zapier as the app and Numbers as the event.
In the setup section, choose Format Currency as the transform type, then use the High 24 H value as the Input. Specify currency and locale, then insert the following in the Currency Format field: ¤#,##0.00.
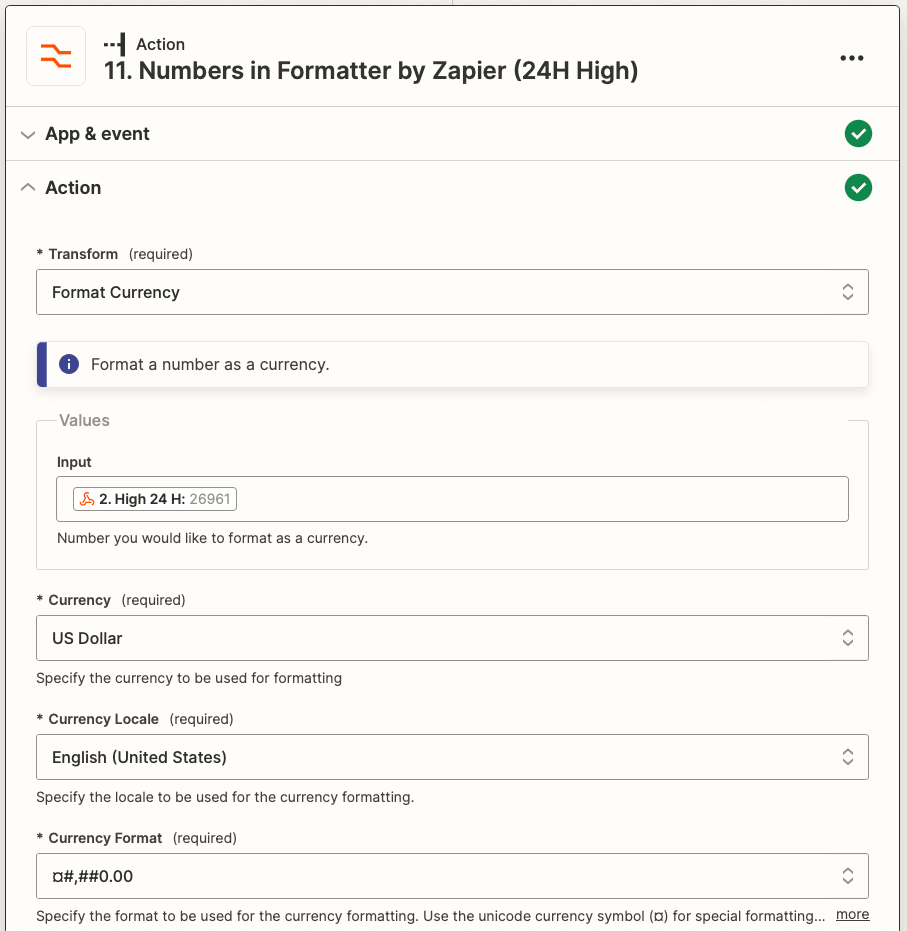
Test the action.
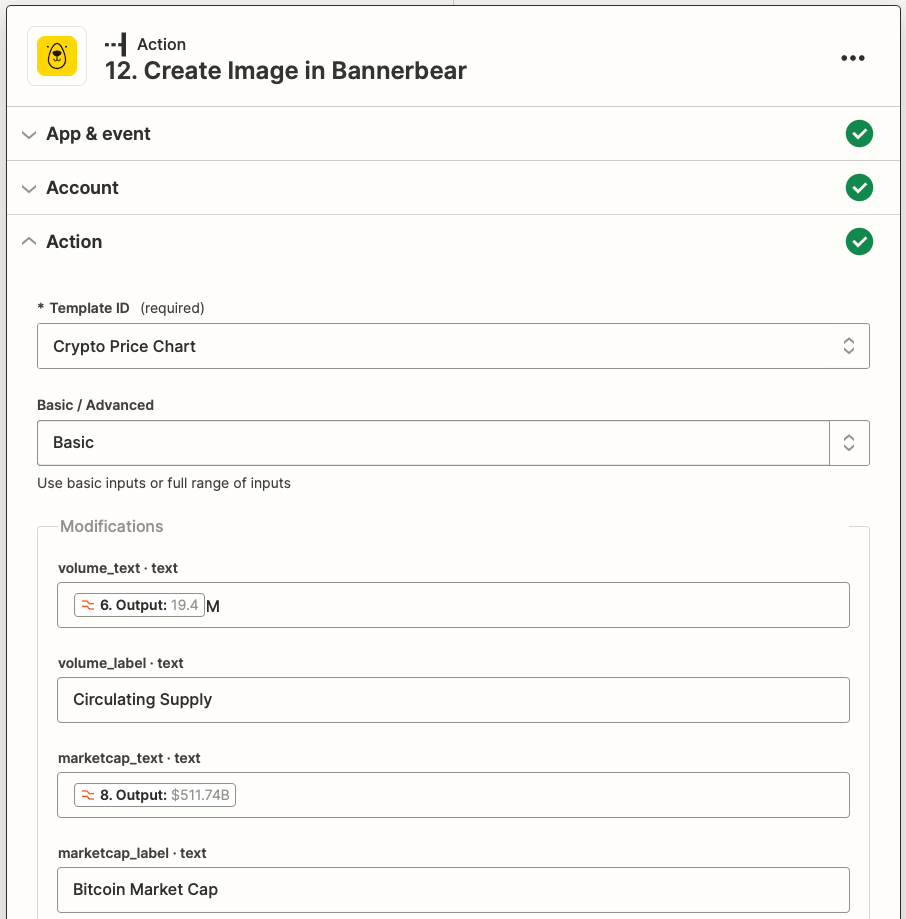
Action: Create Image in Bannerbear
Choose Bannerbear as the app and Create Image as the event. You will need to connect the project using the key found on the “Settings / API Key” page of the corresponding project on the Bannerbear app.
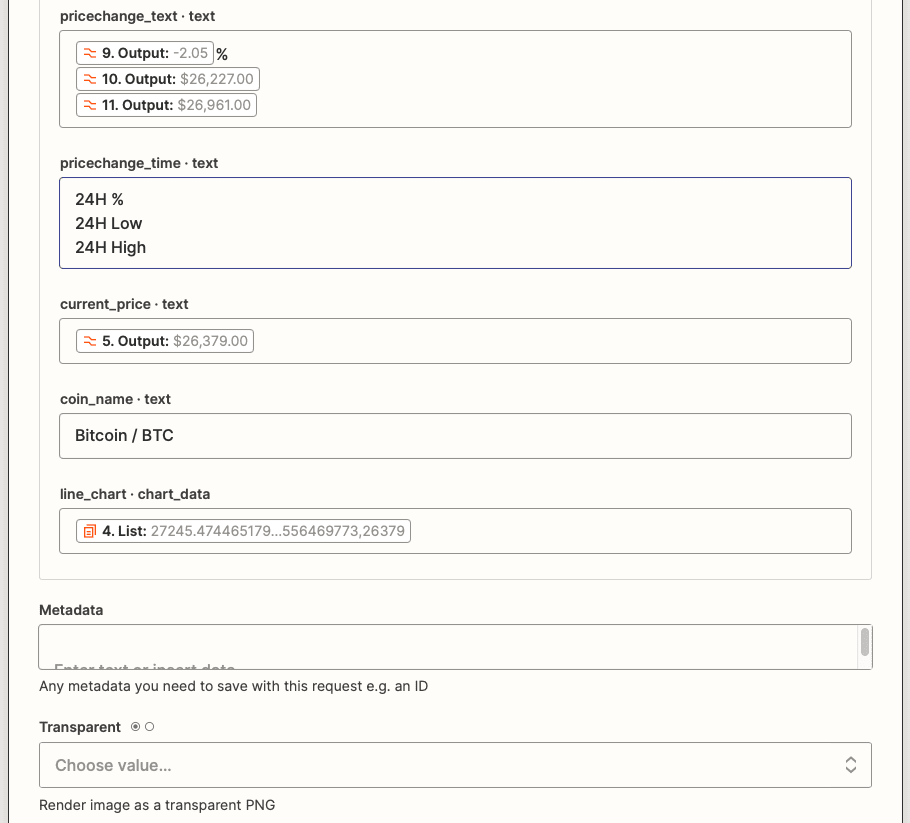
Set up the action by choosing the price chart template you prepared, then map all the values to their corresponding fields. The line chart data will be the digest of current prices.
Test the action. You should be able to generate a pricing chart that looks something like this:
And that’s it!
Tips on Testing Your Pricing Chart
Because this workflow uses a compilation of prices to produce a line chart, you need to either wait for the values to form a digest in an active zap or manually pull values to generate a complete test image. Here are some tips:
- Use the following request URL to accumulate as many test entries as needed:
https://api.coingecko.com/api/v3/coins/bitcoin/history?date=01-01-2023&localization=false. You will need to change the date to retrieve values from a specific time. - Append entries by manually running the Append Entry and Schedule Digest in Digest by Zapier action every time you update the date and send a request to CoinGecko’s API.
- When testing, append entries in chronological order.
- Add an action to Release Existing Digest to force release it for testing.
- When you’re ready to publish your zap, be sure to change the request URL, remove the Release Existing Digest action, and ensure all values are correctly mapped to your Bannerbear template.
Creating Beautiful Pricing Snapshots with Automation
Interactive pricing charts have their uses, but there are times when all you need is a simple, beautiful image that illustrates real-time information. With a handful of apps and a single zap, you can automate the production of these assets for use on your app, site, or social account.